For the end-to-end flow, see the incident lifecycle diagram in
Architecture Overview.
How Incidents Are Grouped
An incident represents the invalidation of an assertion over a one-hour time period. Multiple dropped transactions can belong to the same incident if they violate the same assertion within that window. Why group transactions into incidents?- An attacker may craft multiple transactions that all violate the same assertion—these represent the same logical attack
- One hour is a reasonable estimate for how long an attack attempt might last
- After one hour without violations, a new invalidation likely indicates a different attack and creates a new incident
This is our initial approach to incident grouping and may be refined based on user feedback.
Project Incidents (Manager View)
Project incidents are visible only to the project manager and live inside the project dashboard.
Access and Navigation
- Open a project and select the Incidents tab.
- Route:
/projects/{project_id}/incidents
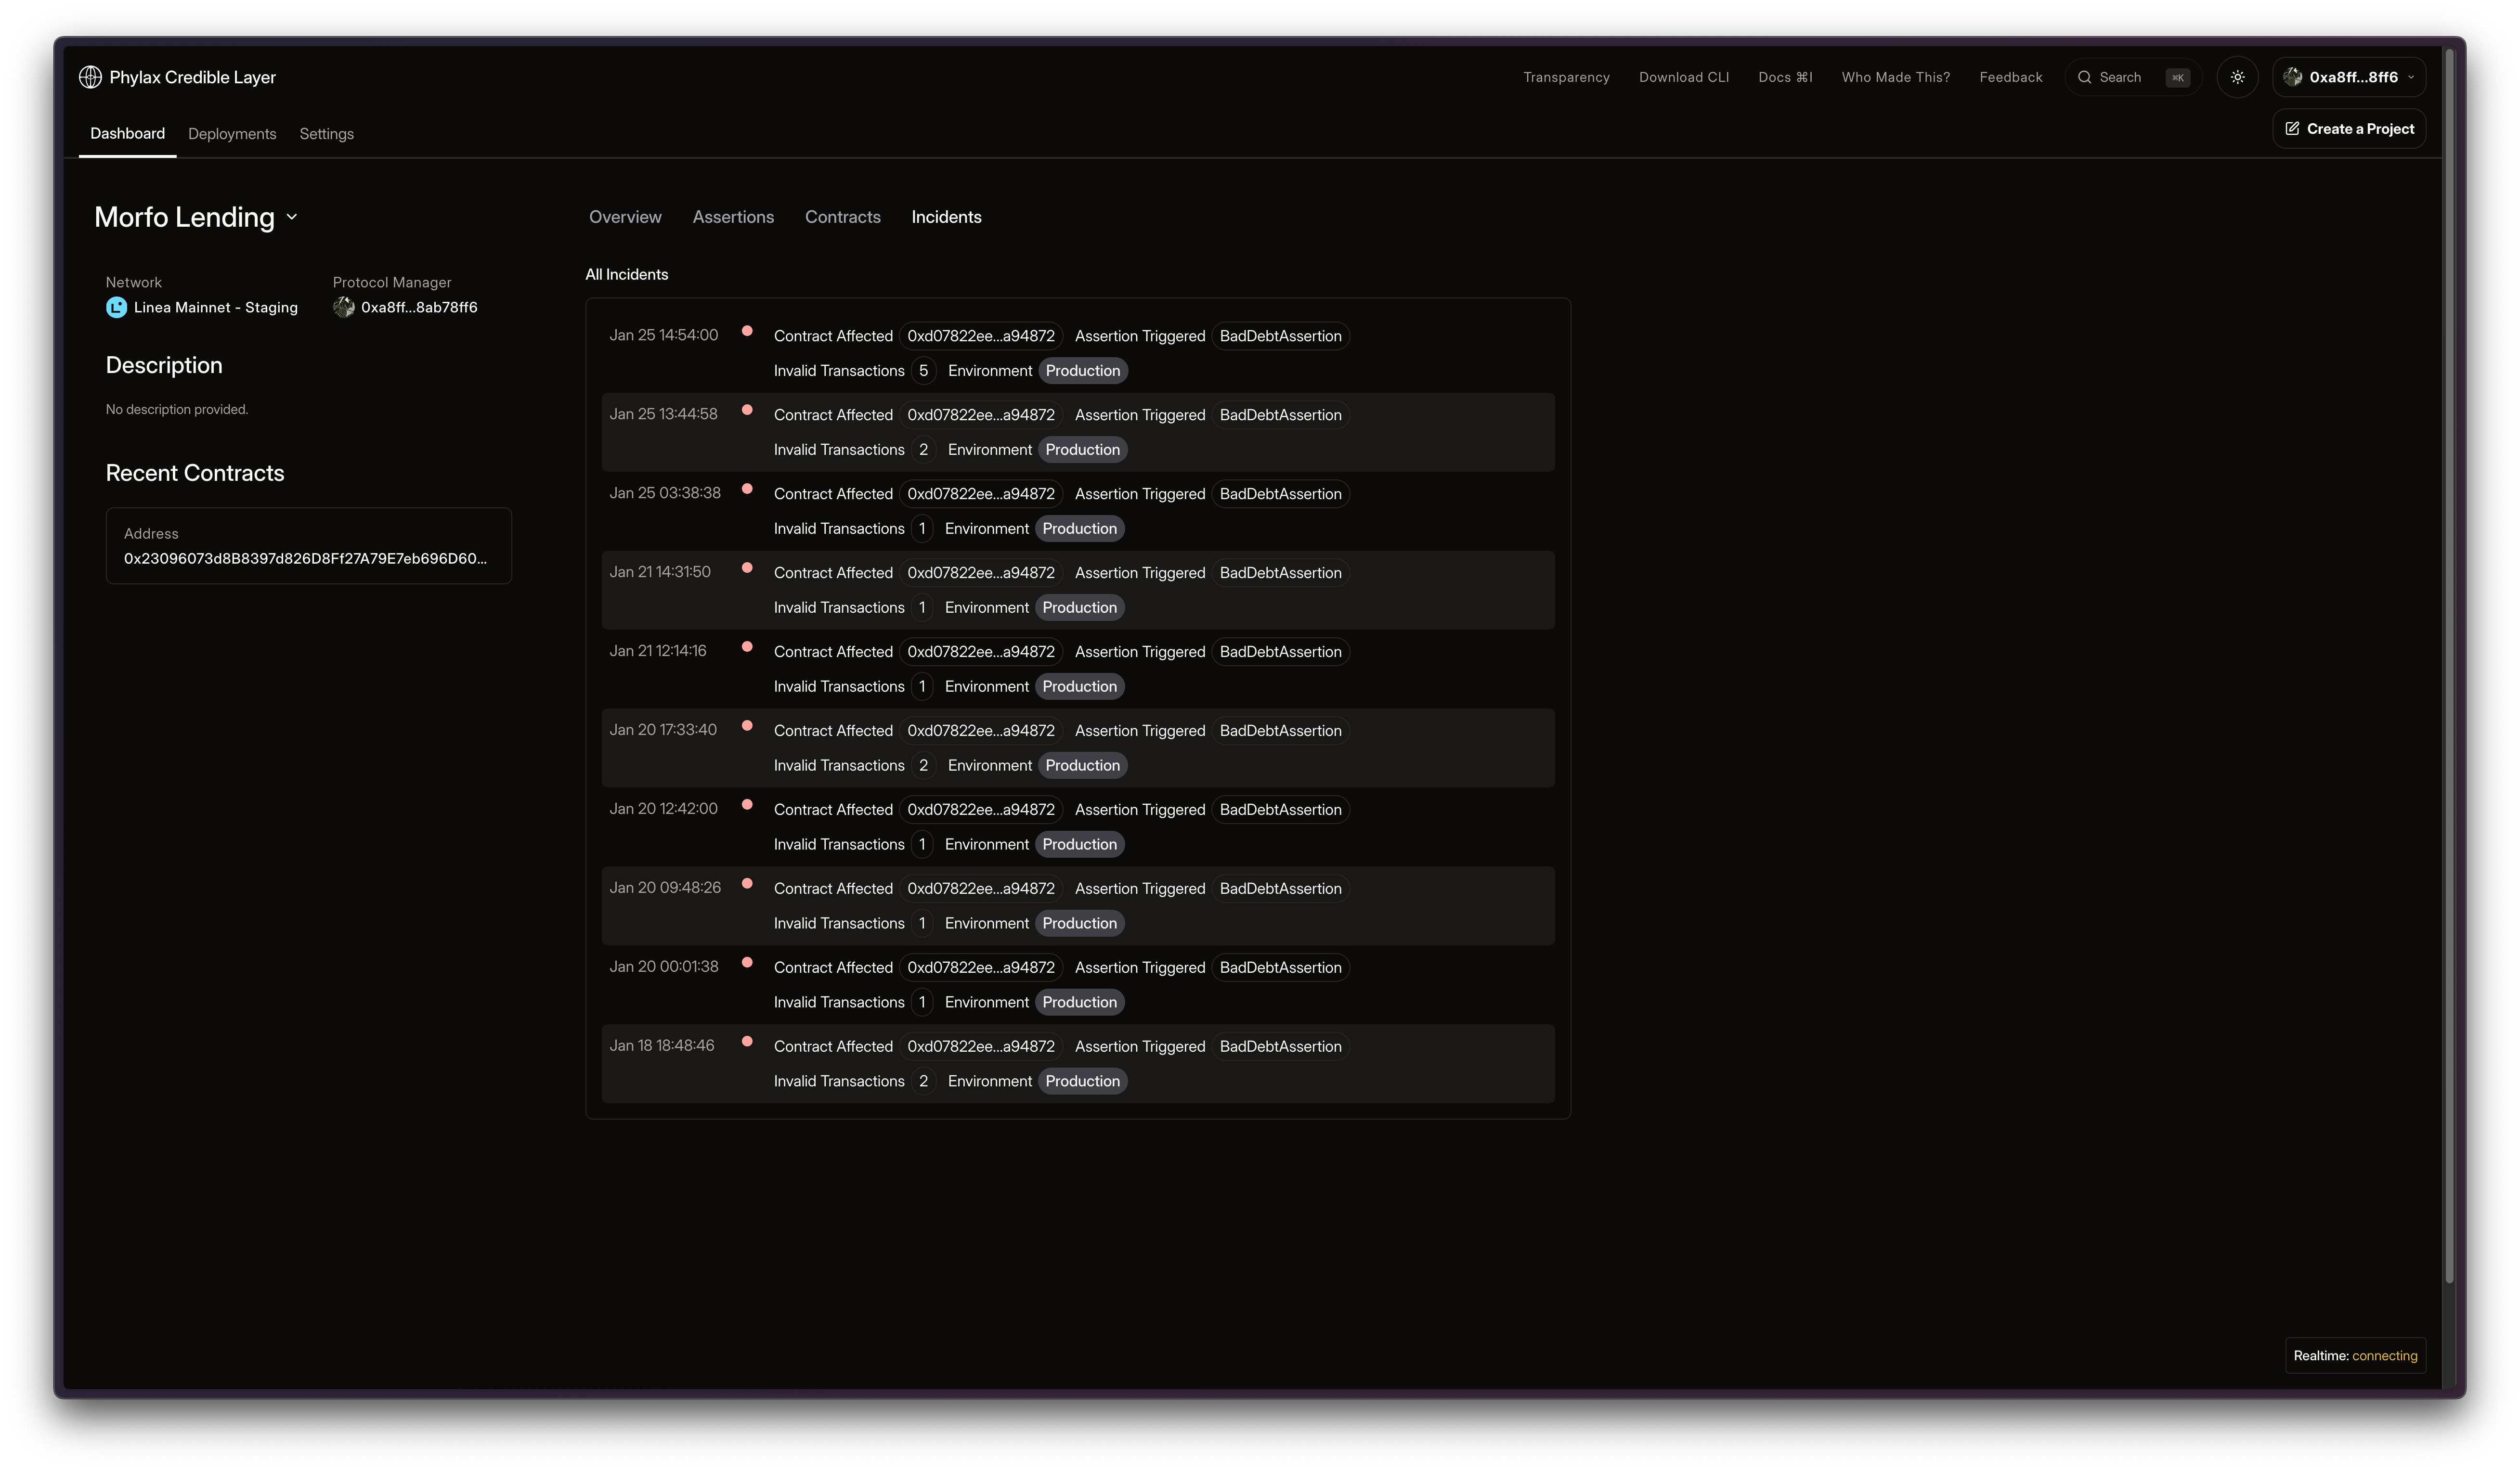
Incidents
The incidents list shows recent incidents for the project, ordered by most recent. Each row includes:- Timestamp
- Contract Affected
- Assertion Triggered
- Invalid Transactions count
- Environment (staging or production)
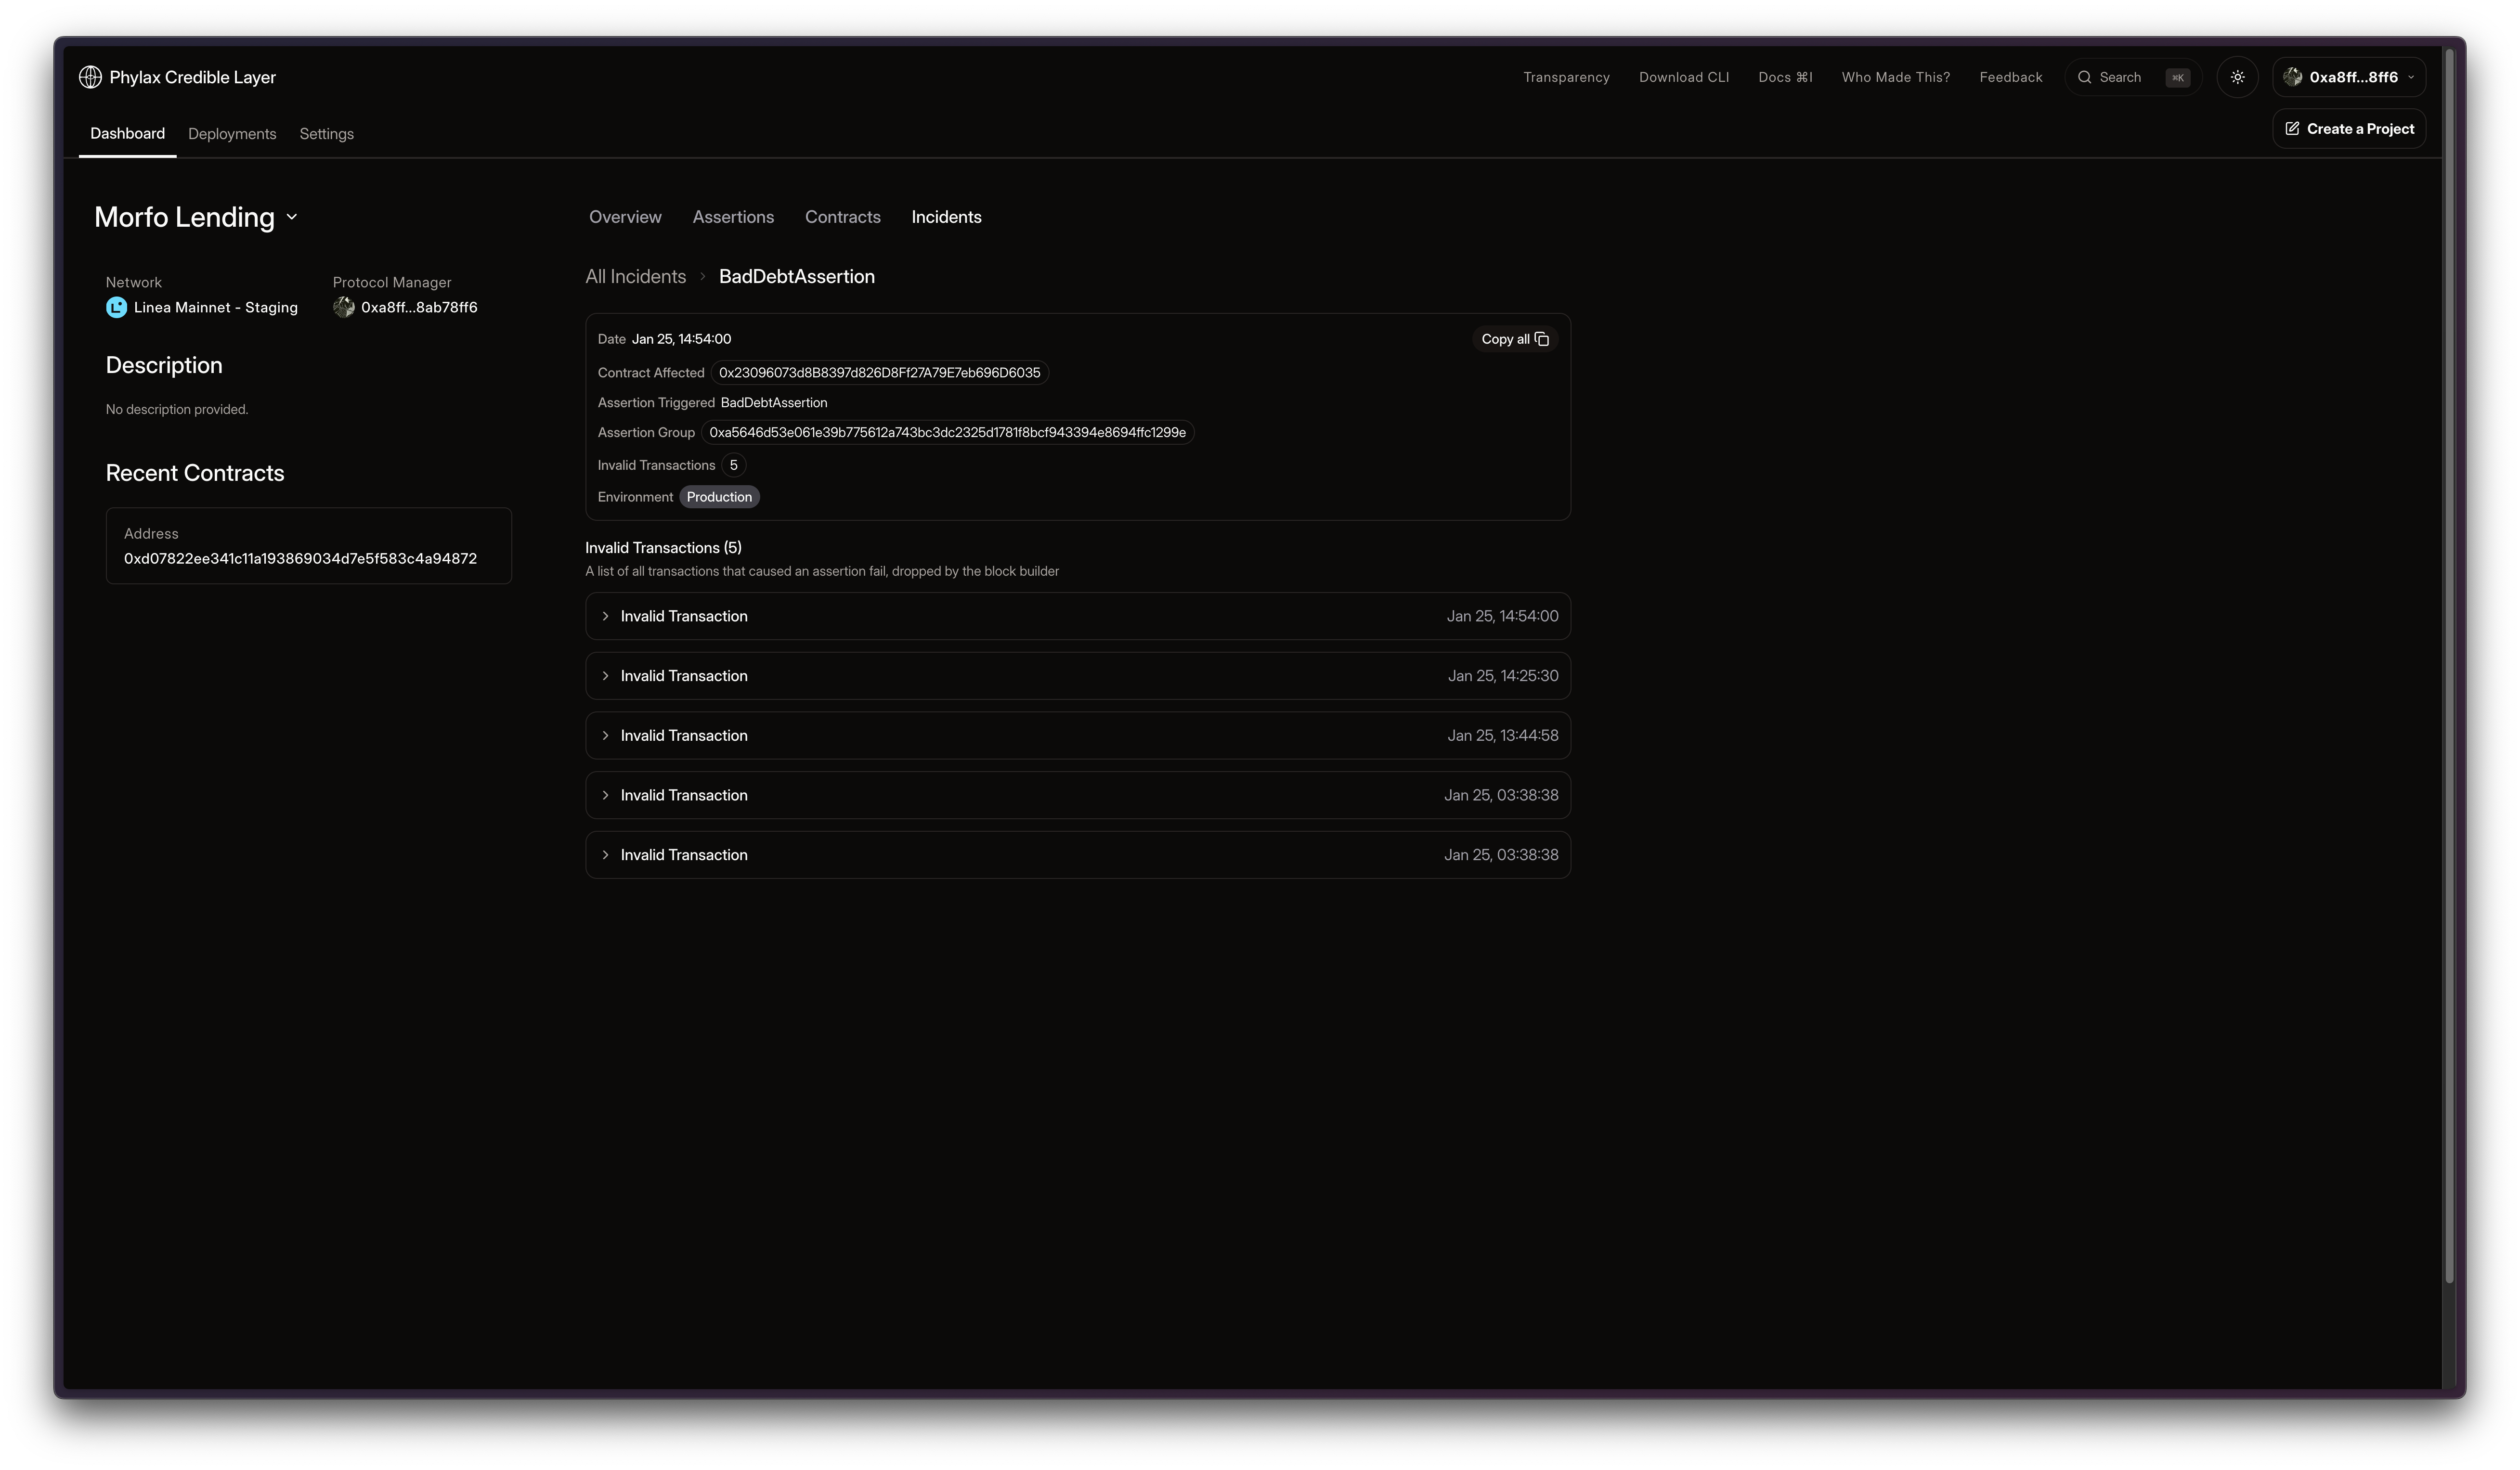
Incident Detail and Invalidating Transactions
The incident detail page summarizes the incident and lists invalidating transactions. It includes:- Incident detail card with date, contract affected, assertion triggered, assertion group, invalid transaction count, and environment
- Critical warning banner if any invalidating transaction landed on-chain
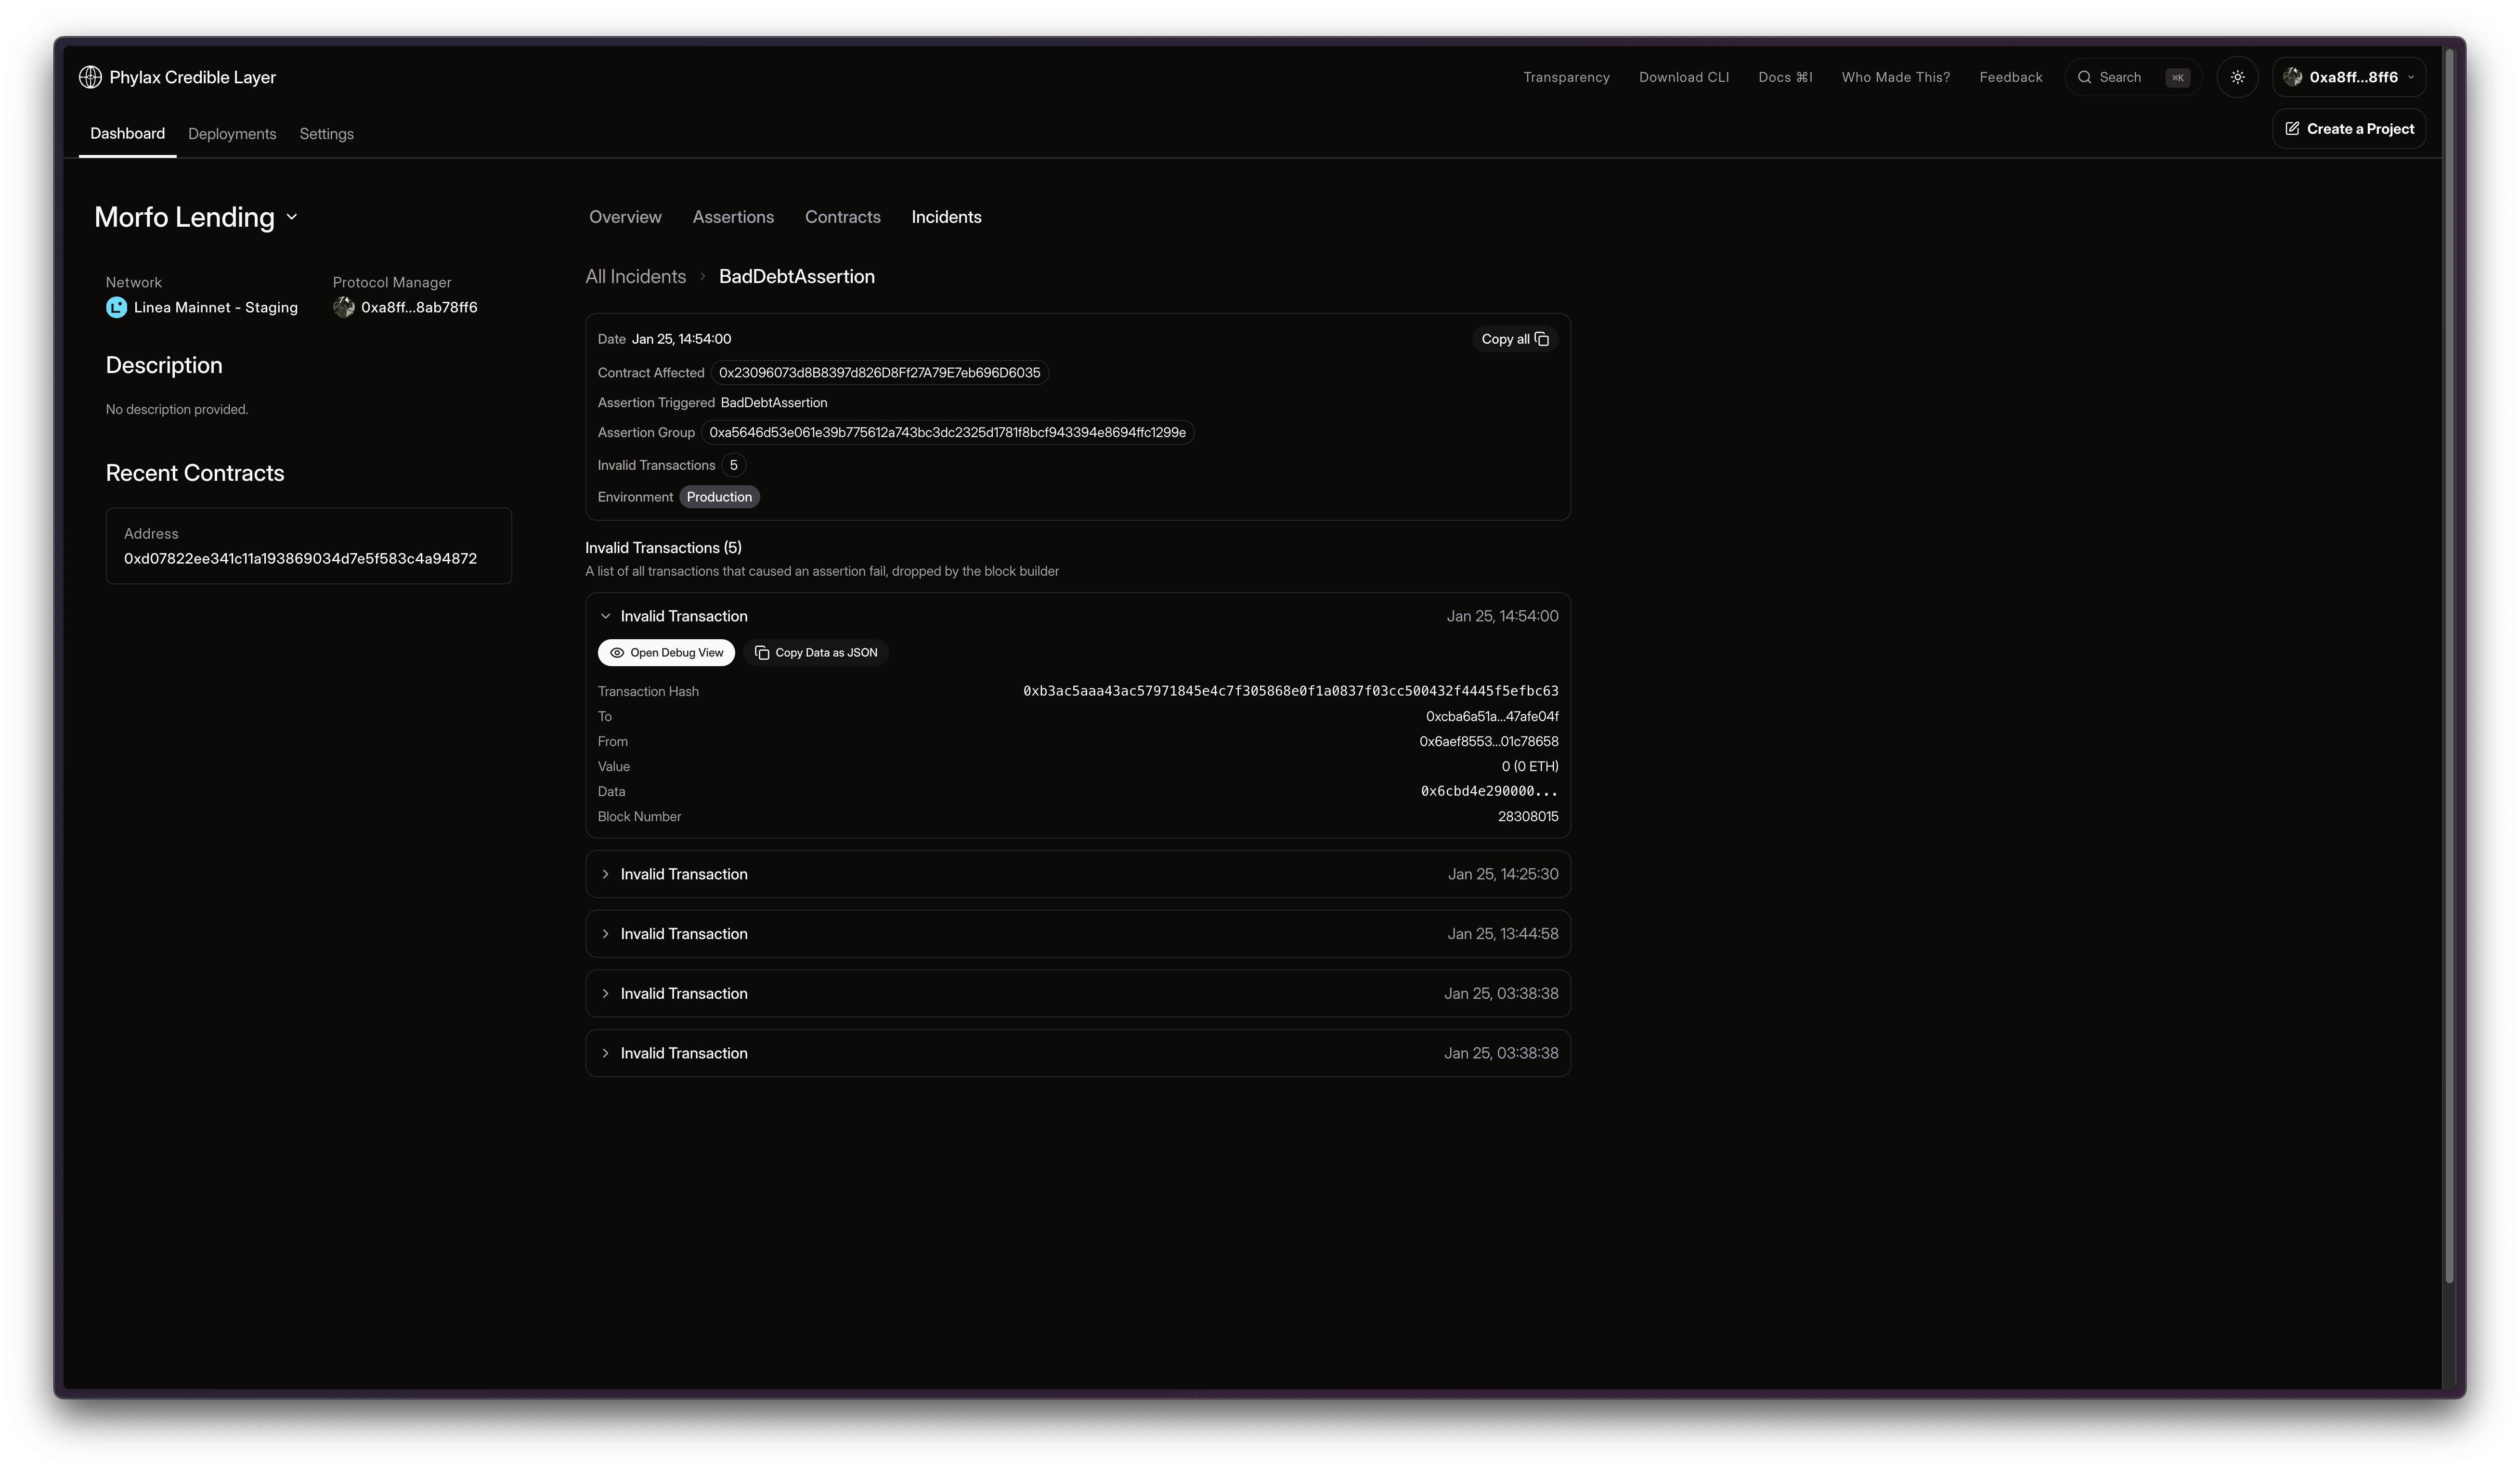
- Invalid Transactions list with expandable rows and action buttons
- Transaction hash, to/from, value, calldata, and block number (if available)
- Open Debug View to inspect the trace
- Copy Data as JSON to export the transaction
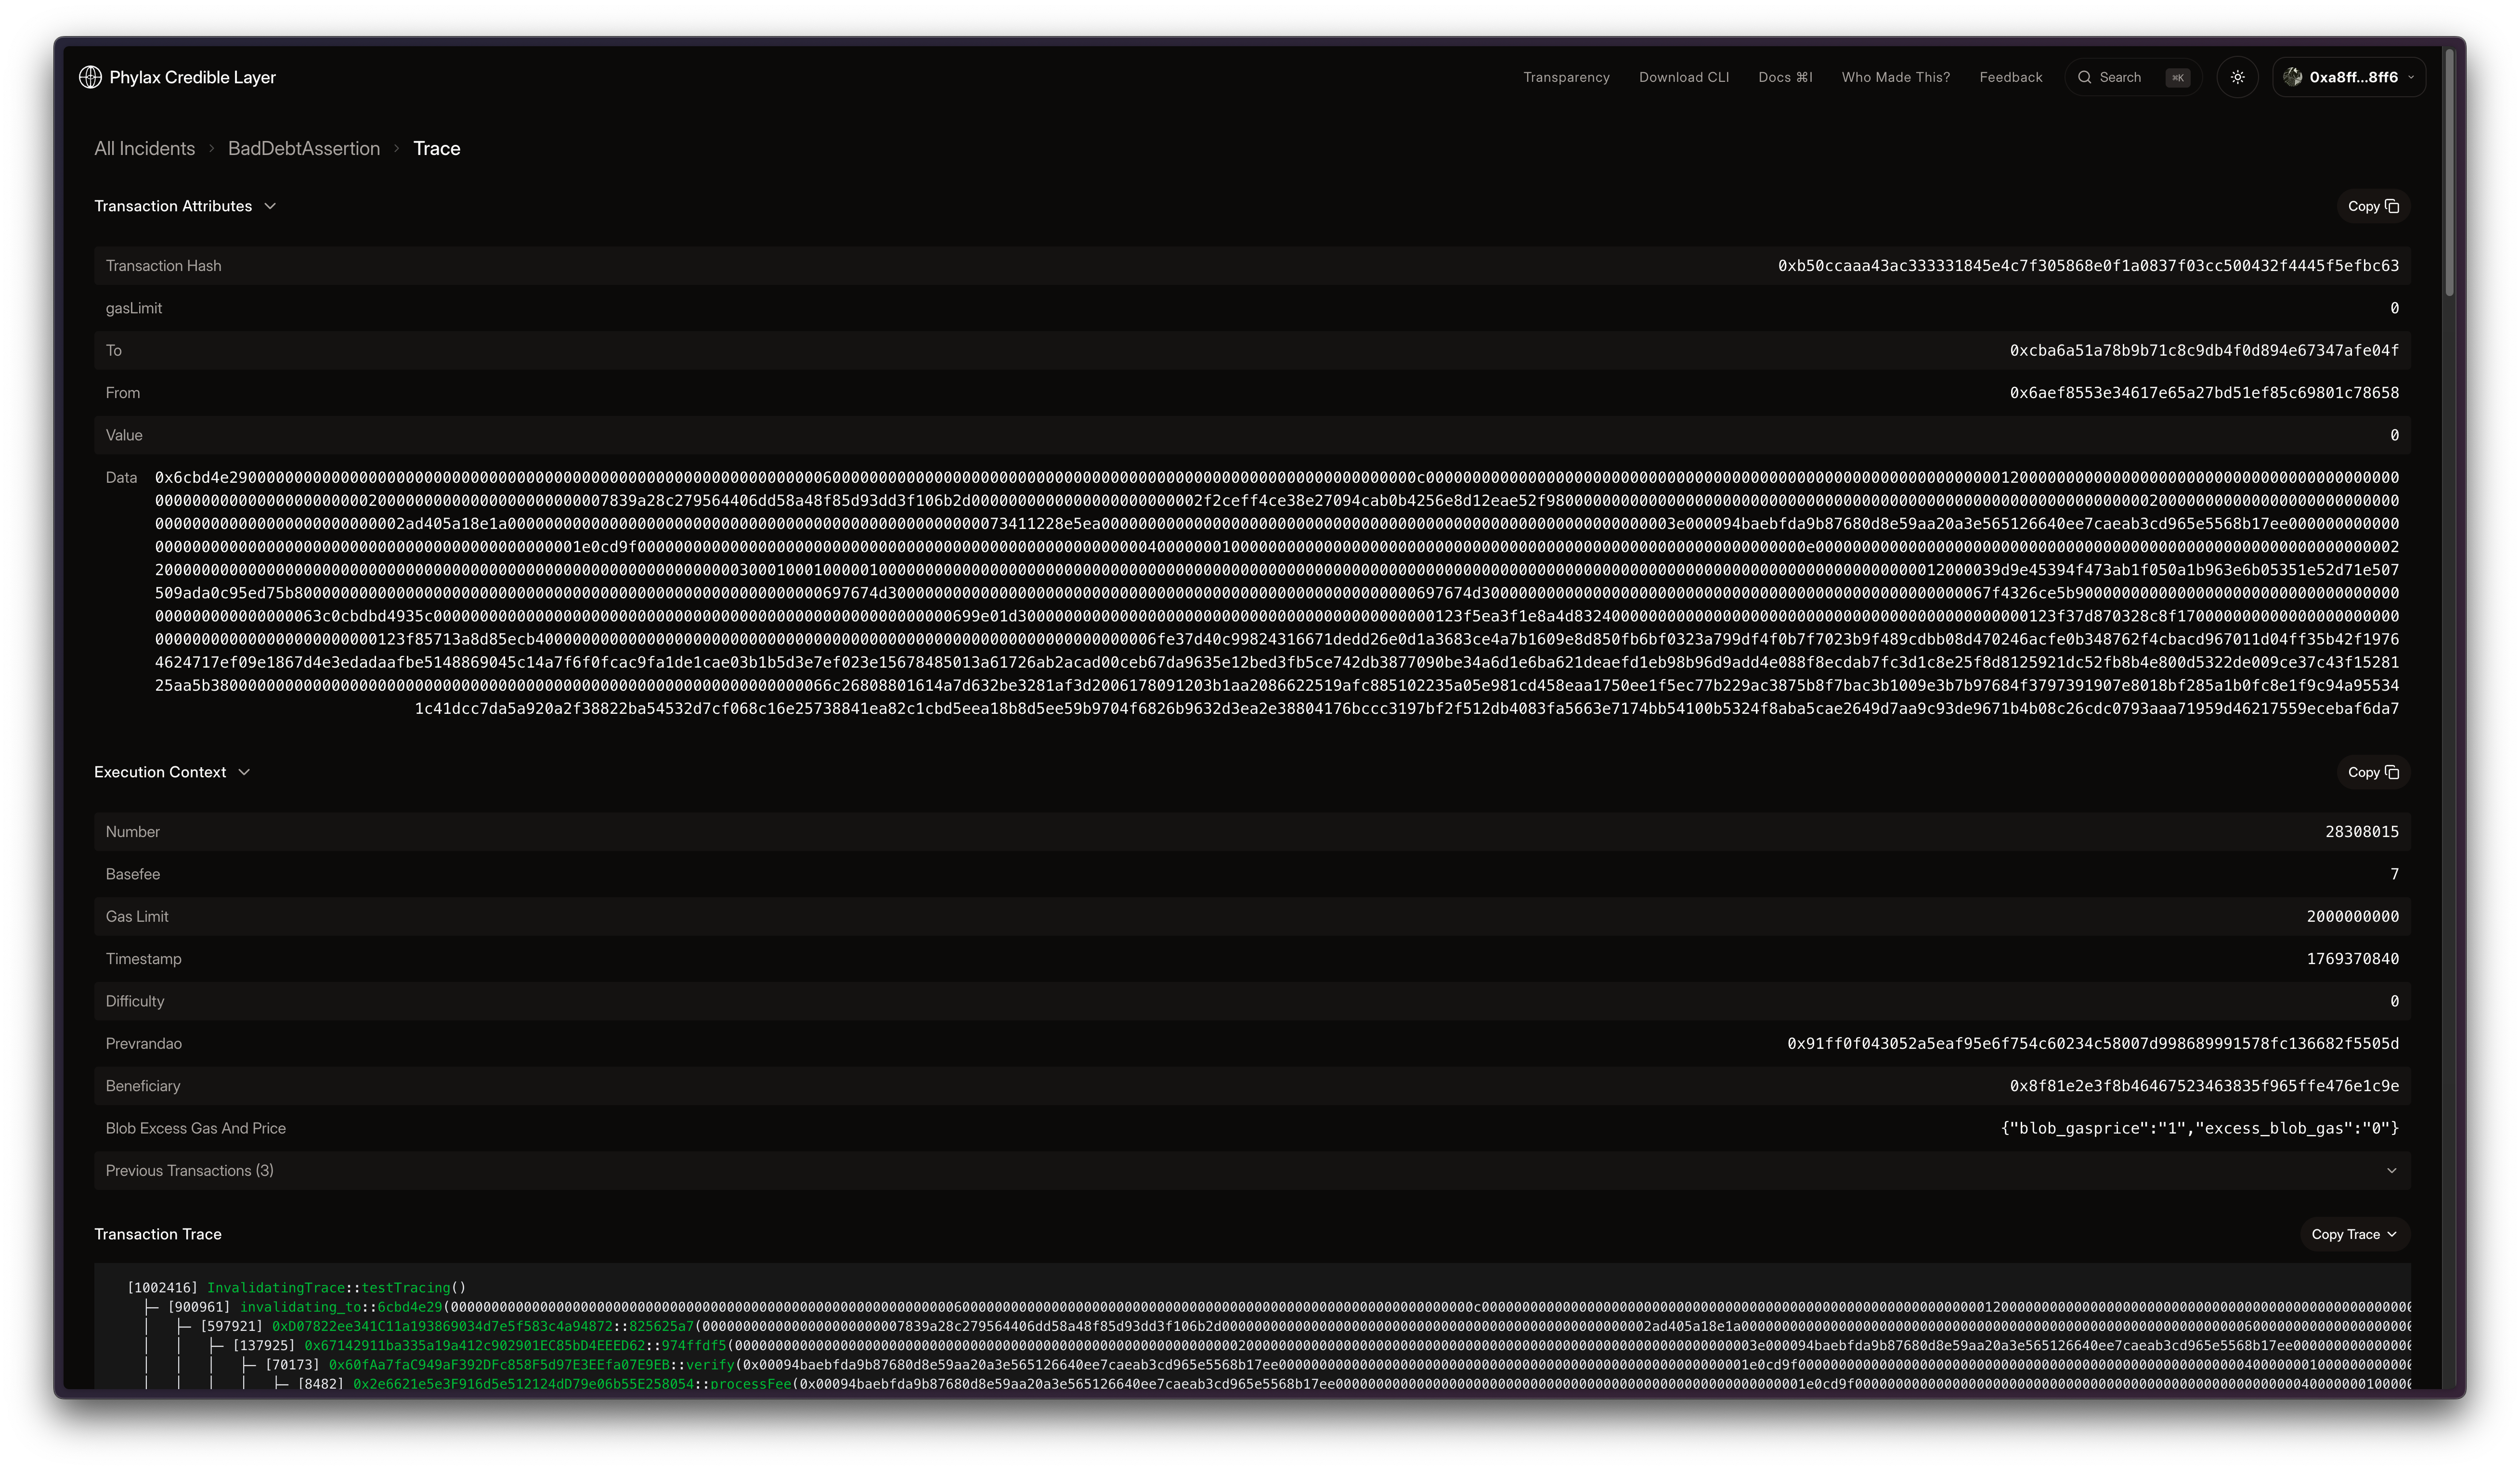
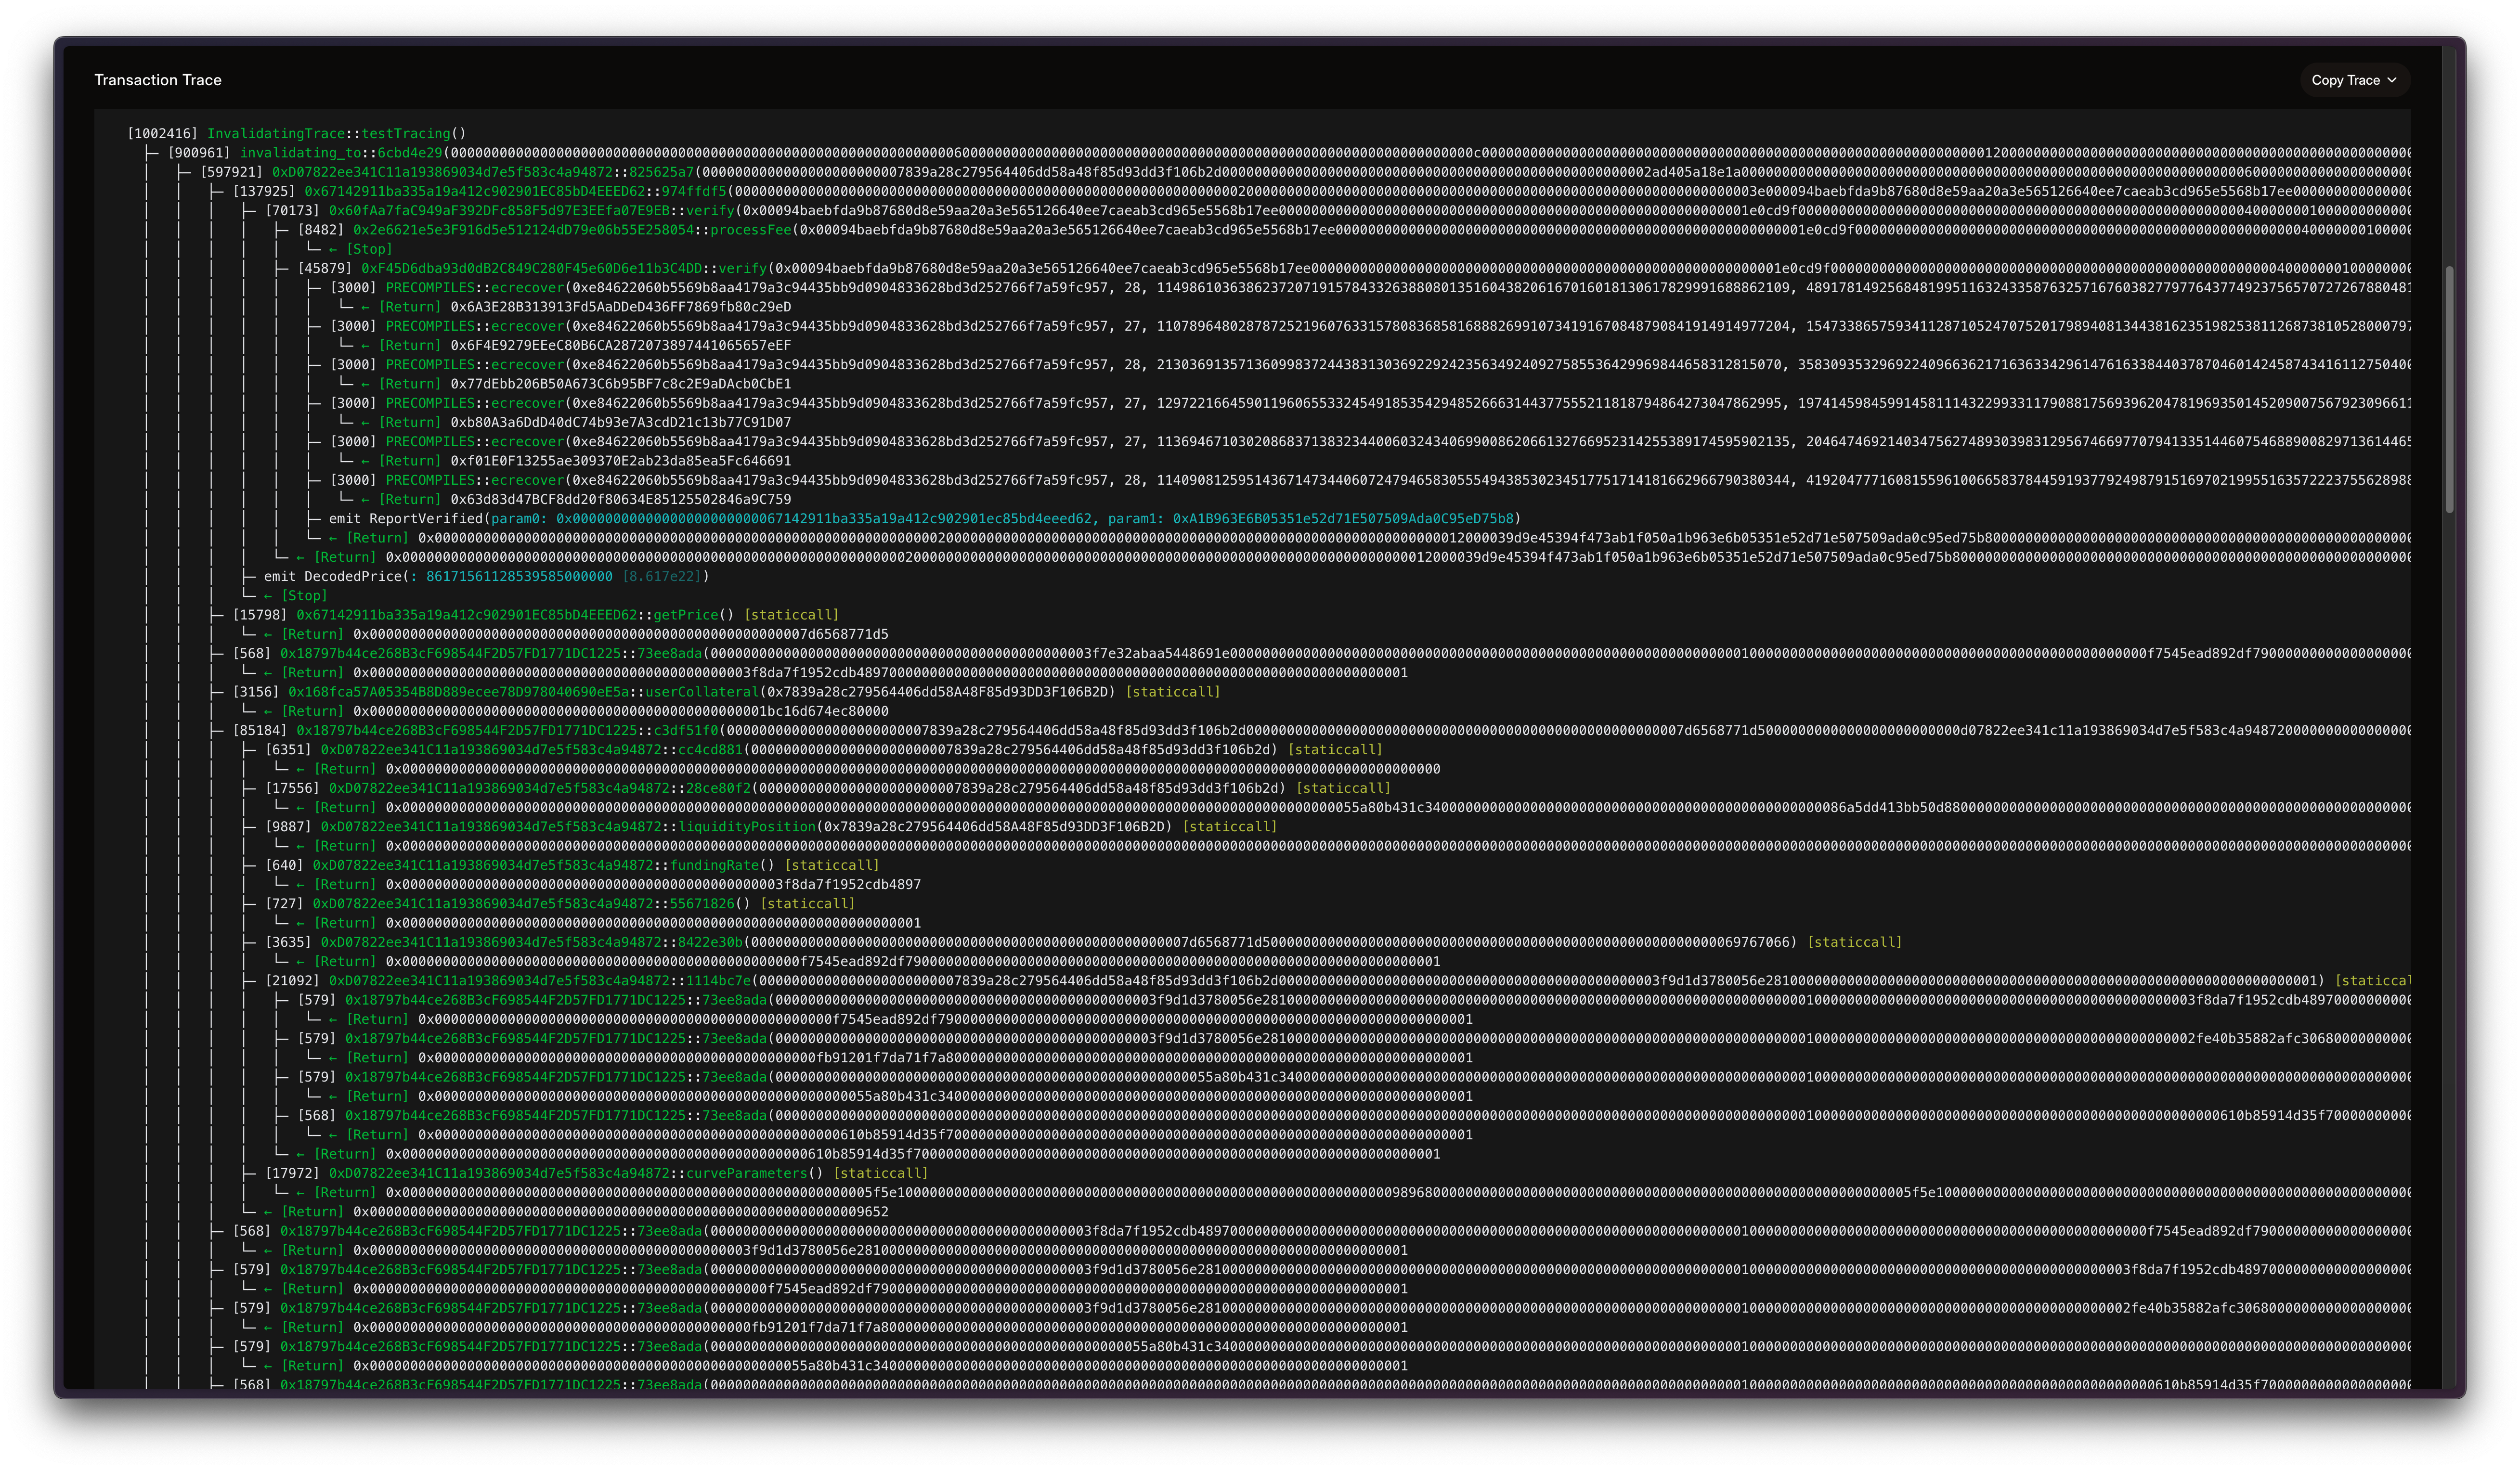
Debug Trace View
The debug trace view opens from an invalidating transaction.- Route:
/projects/{project_id}/trace/{incident_id}/{transaction_id} - Transaction Attributes panel with copy-all action
- Execution Context panel (block environment + previous transactions)
- Transaction Trace panel with status: pending, in progress, completed, failed, or skipped
Real-Time Updates and Alerts
When a project manager is viewing the incidents list, new incidents stream into the list in real time. You can also set up external alerts via webhooks:- Slack Integration: Configure Slack webhooks to receive incident notifications
- PagerDuty Integration: Configure PagerDuty webhooks to receive incident notifications
Public Transparency Incidents
The Transparency dashboard includes a public incidents list with limited metadata for visibility. Detailed transaction and trace views are only available to project managers.Use Cases
- Monitor when assertions prevent violations for your projects
- Understand attack patterns and attempted exploits targeting your protocol
- Add or refine assertions based on incident data
Next Steps
Platform Overview
Learn more about the platform
Transparency Dashboard
Browse projects and assertions
Writing Assertions
Learn how to write effective assertions
Architecture
Understand how assertion validation works